Apps for Tableau NEVER gets access to your data We offer SAAS and On-Premise extension deployments
As of Tableau 2018.2, the world meets the Tableau Extensions API. This new API allows us to directly integrate web applications into our dashboards by dragging them from the objects pane to your dashboard using Tableau Desktop Creator. With Extensions for Tableau, one can interact with data sources and add new visualization types to your dashboards while still maintaining high rates of interactivity.
Use cases we think might interest you
Some of the advantages of Tableau Extensions
ScrollyTelling
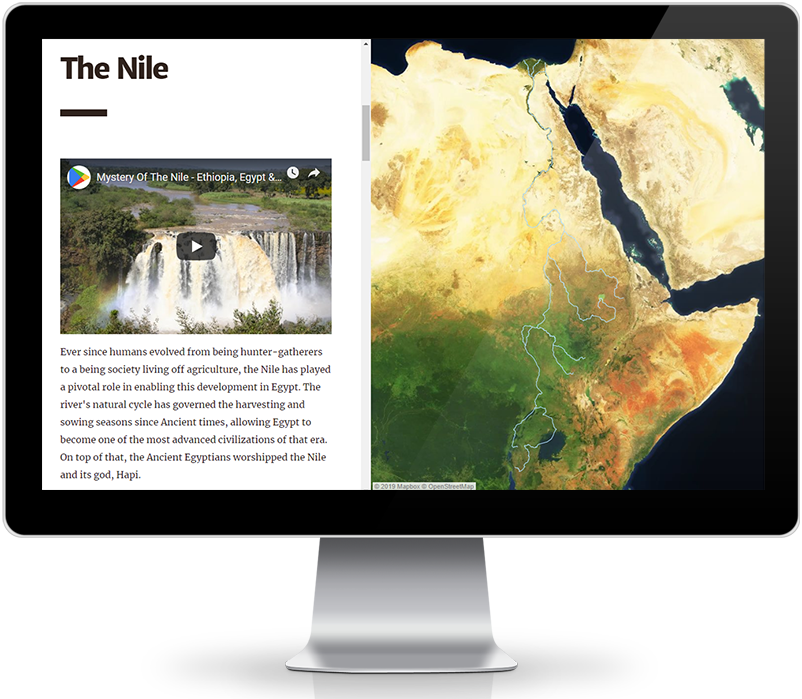
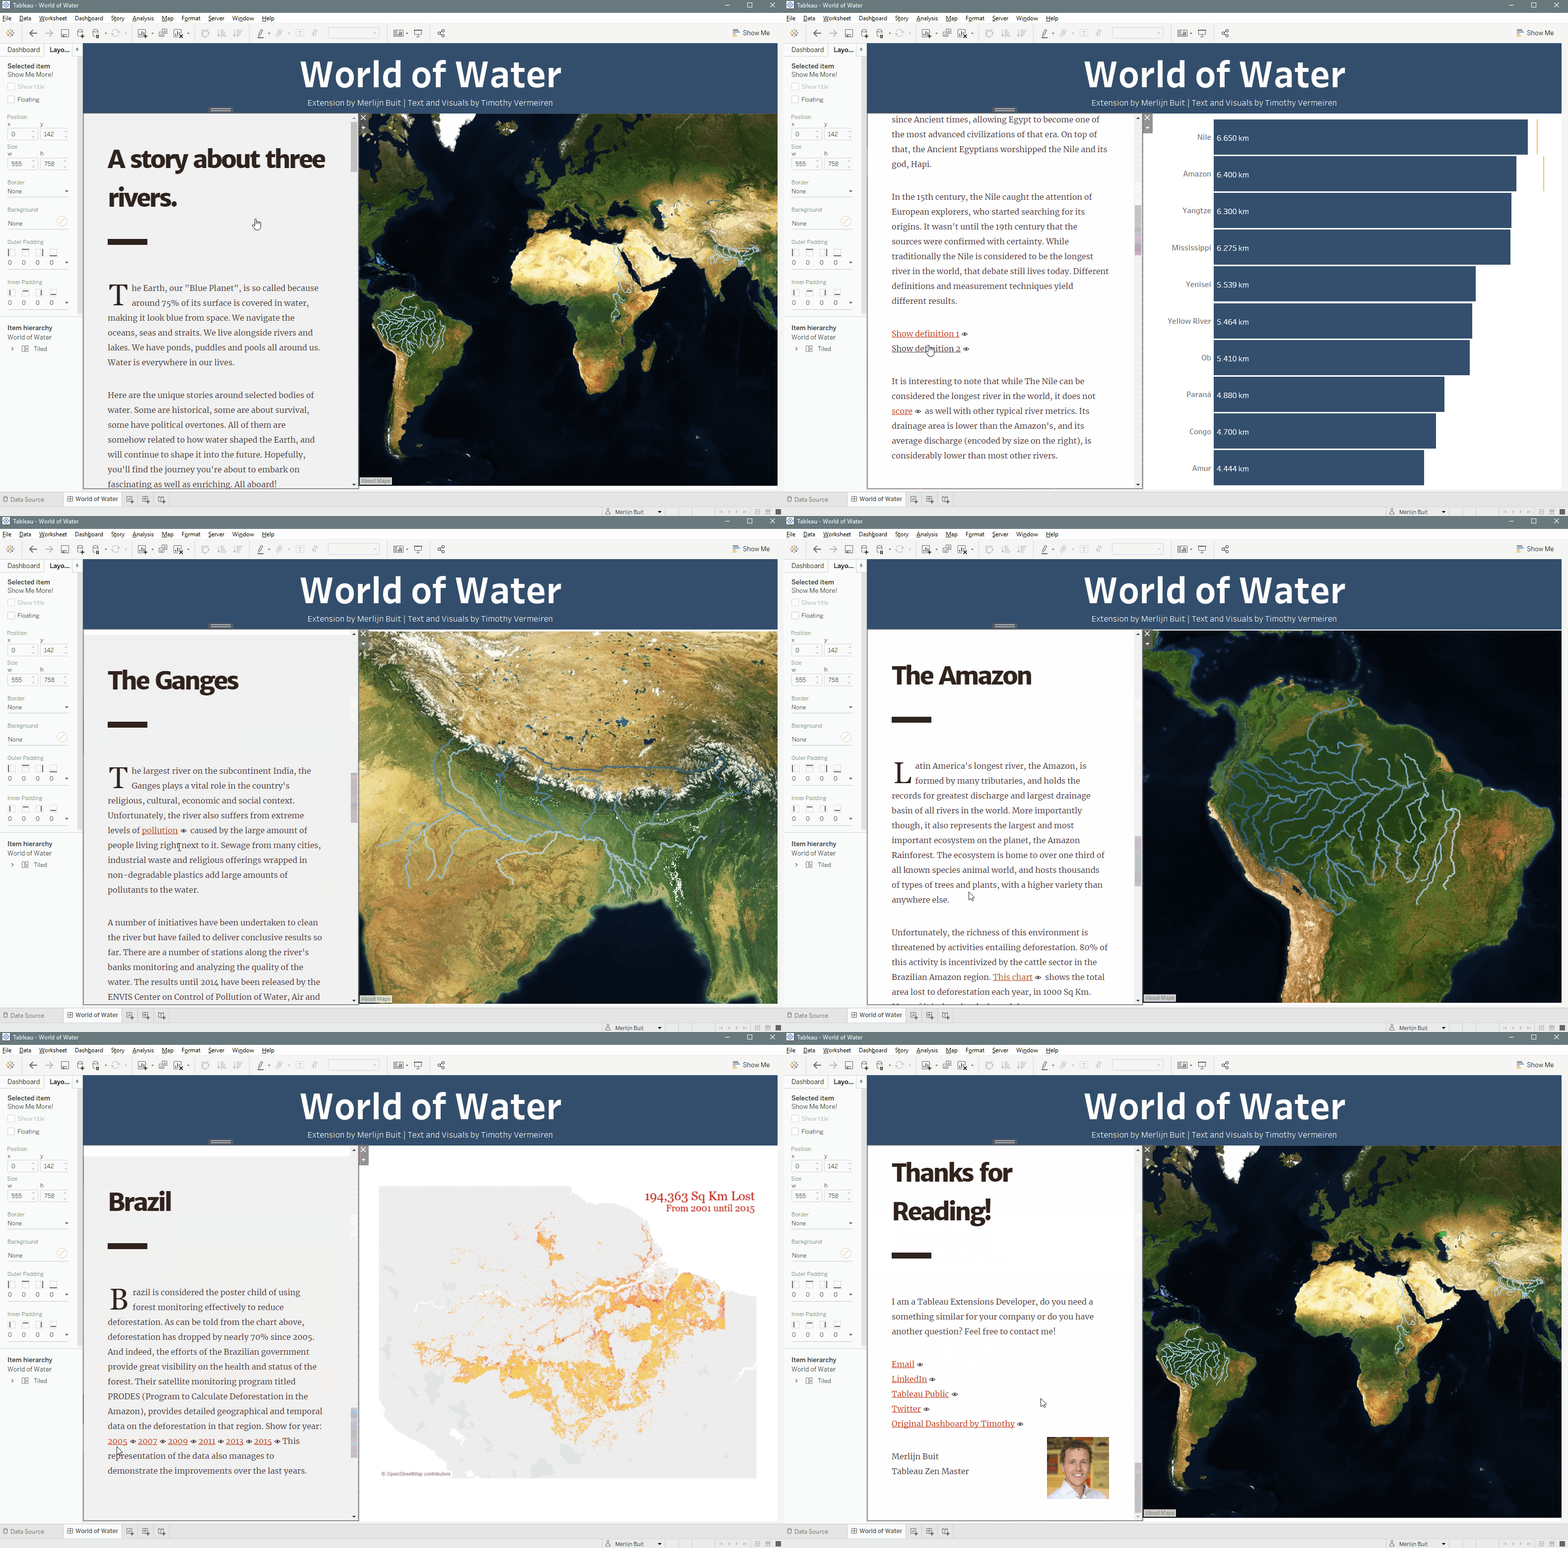
Tableau allows you to add storypoints to create bullet-wise stories. A very welcome function in explaining the findings of your analysis in predefined clicks or guiding your visitors along your dashboards. Creating stories with extensive amounts of text, motivations, conclusions and rich layout functions combined with illustrative visualizations are not easily done in Tableau. Until now. Meet our ScrollyTelling extension for Tableau!
With ScrollyTelling you can present your story in text, images and even Youtube movies, and show the appropriate Tableau illustrations where you want them to show up in the story. Allow animations in your dashboards and use the setting of filters, parameters and highlights to create stunning stories with impact.
SuperTables
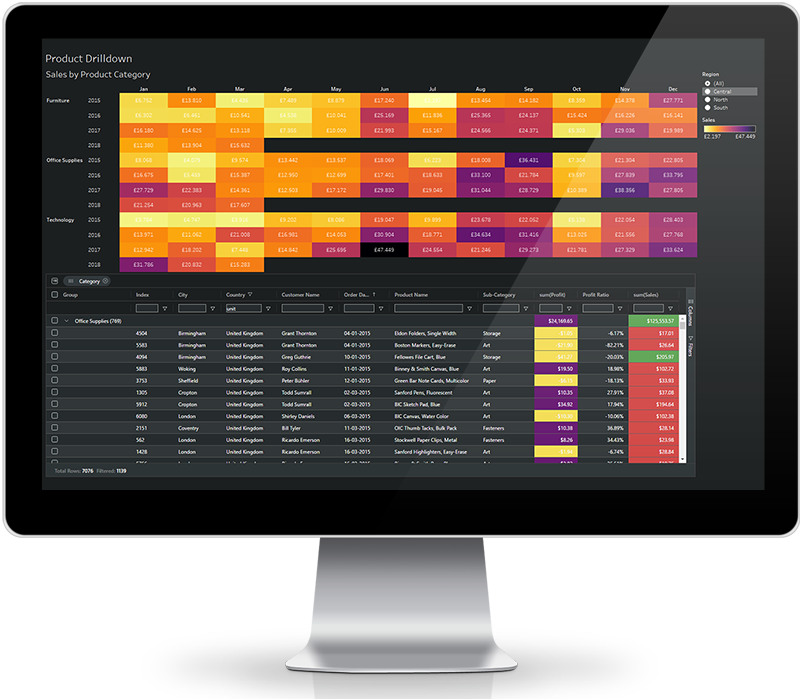
Every now and then we all use tables in our Tableau Dashboards. You probably use them to create context boxes, drill down a simple hierarchy or add some other detail to your visualizations. Tableau Tables offer great general functionality but when it comes to custom grouping, filtering or pivoting for example they lack the power and freedom to the dashboard user.
With the SuperTables extension for Tableau, you can offer your dashboard users the power of interactive and dynamic tables that let users decide how to organize or analyze their data in a flexible grid.
ShowMeMore
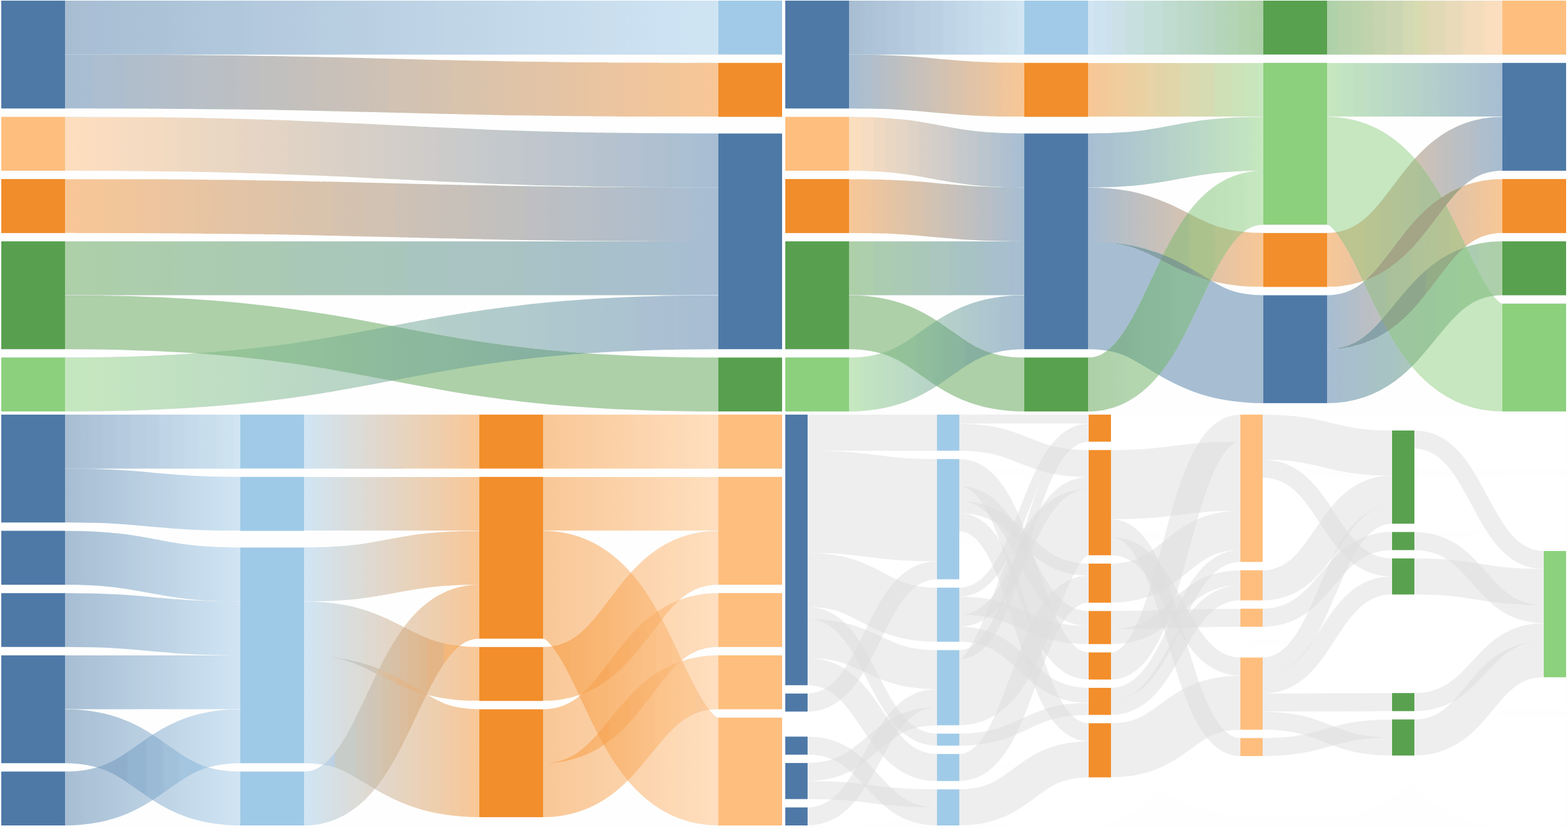
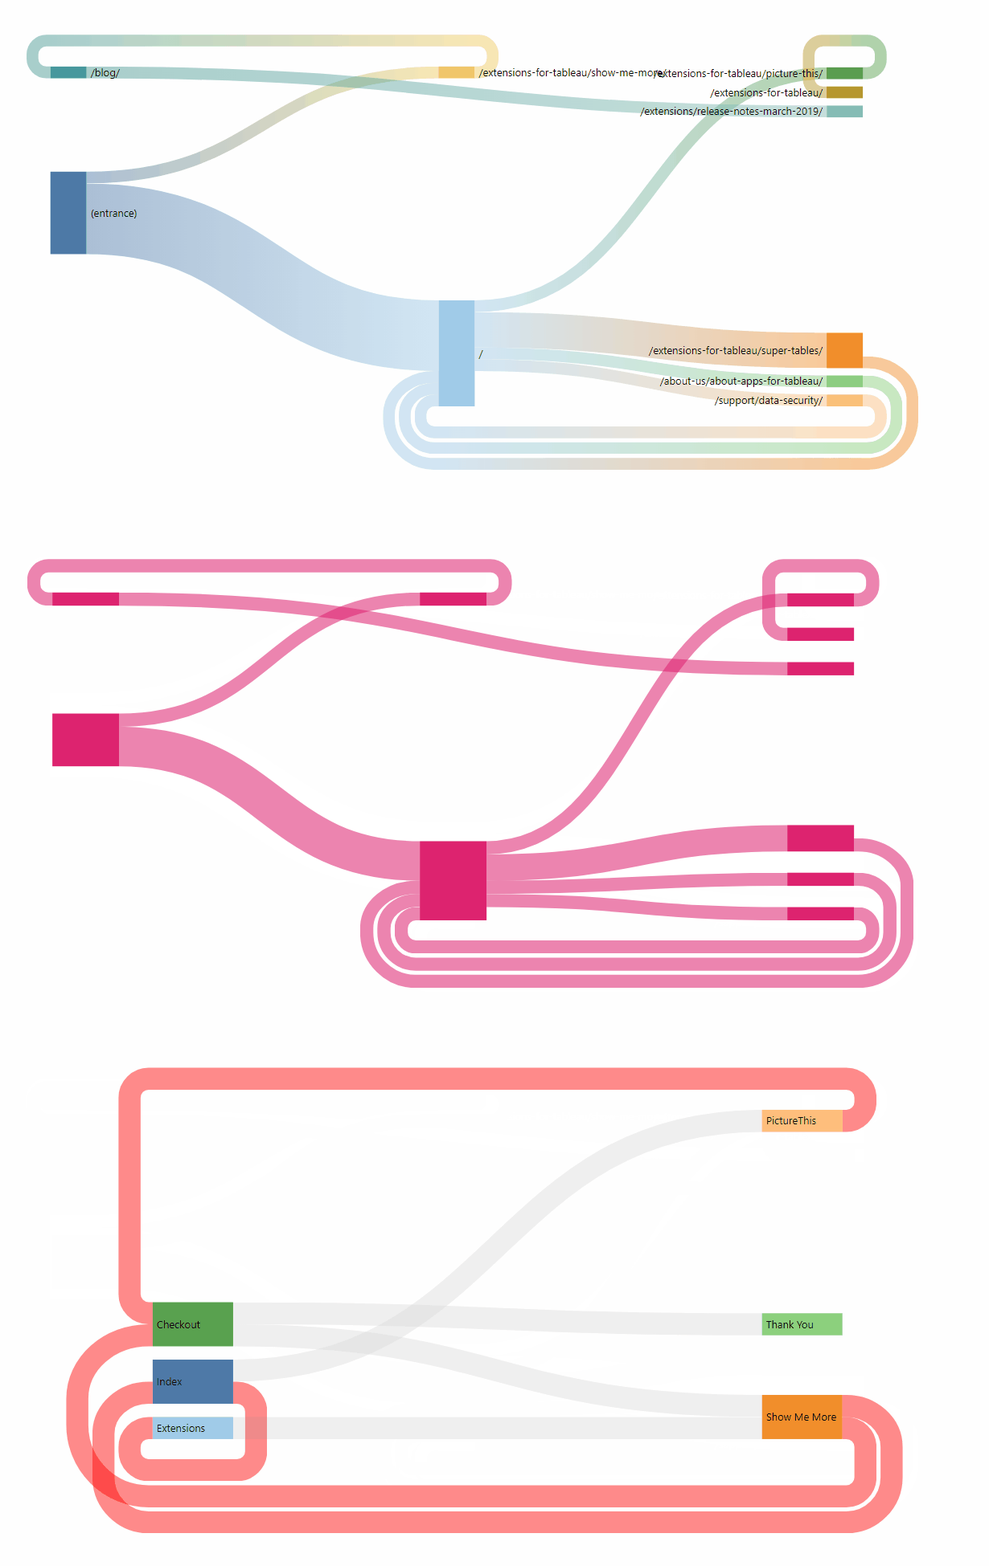
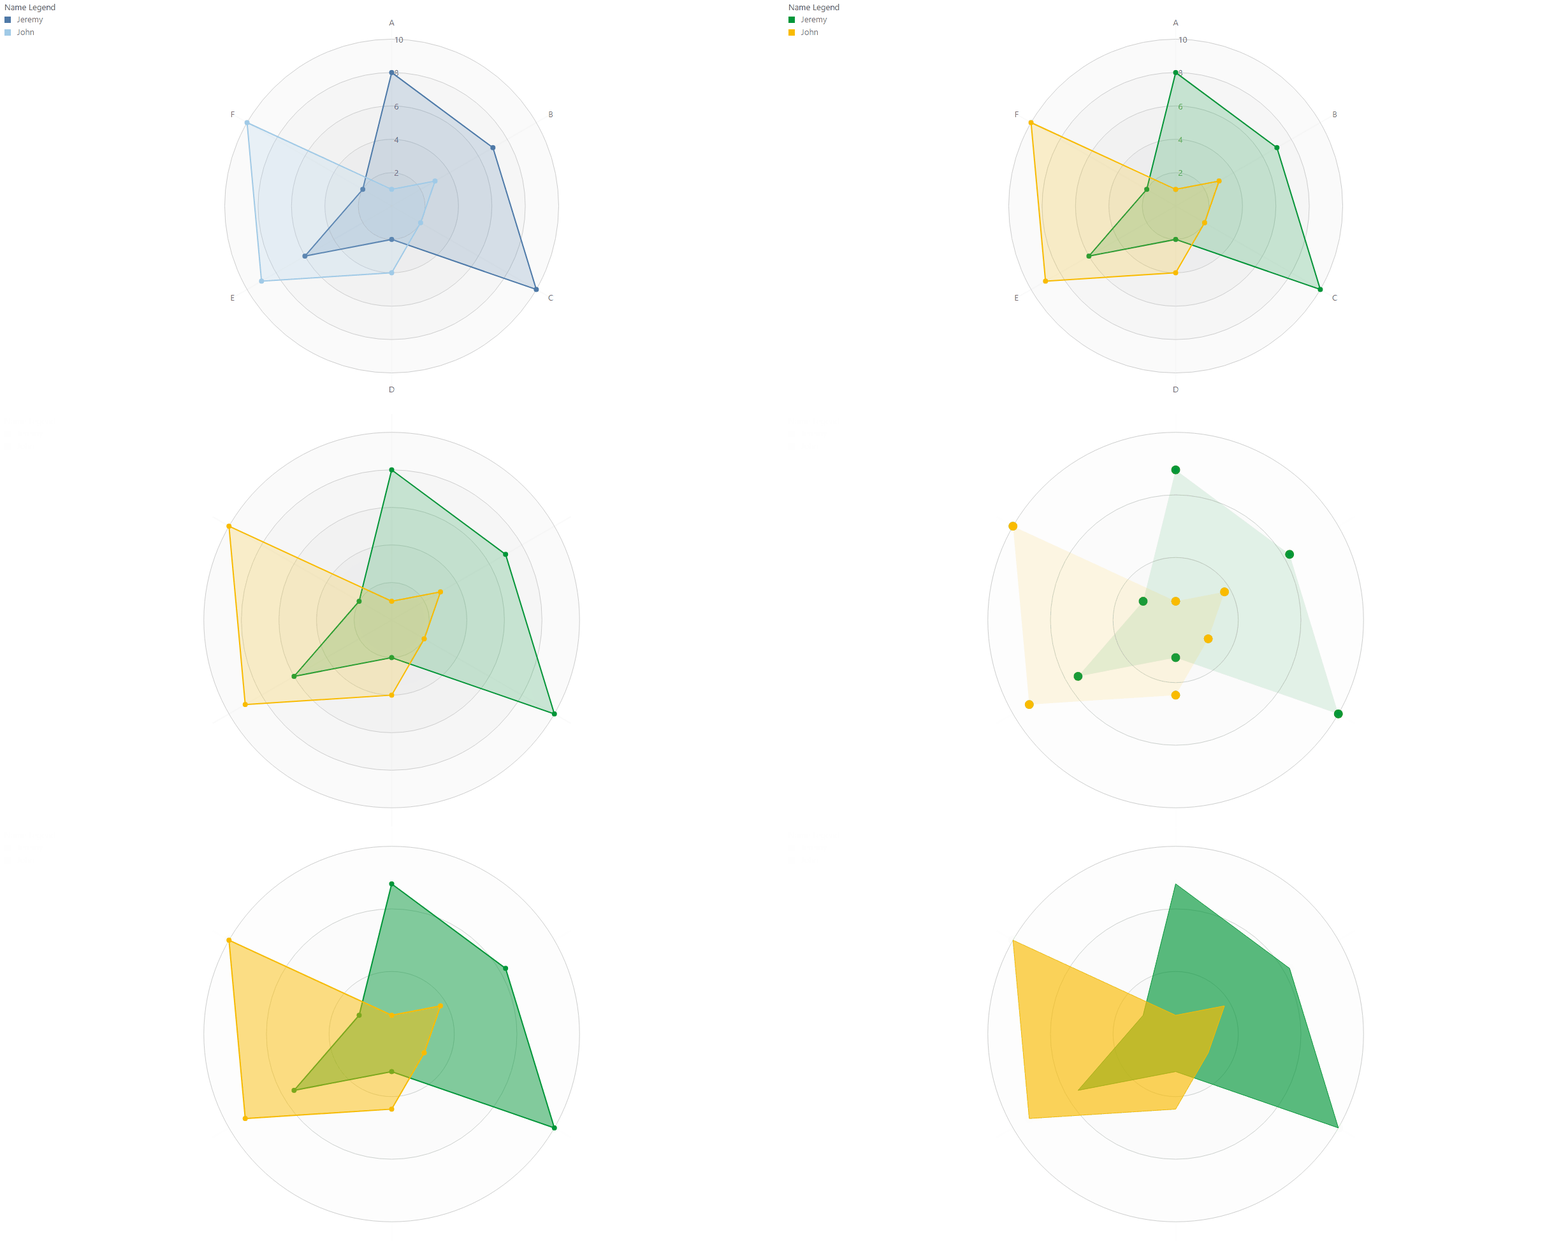
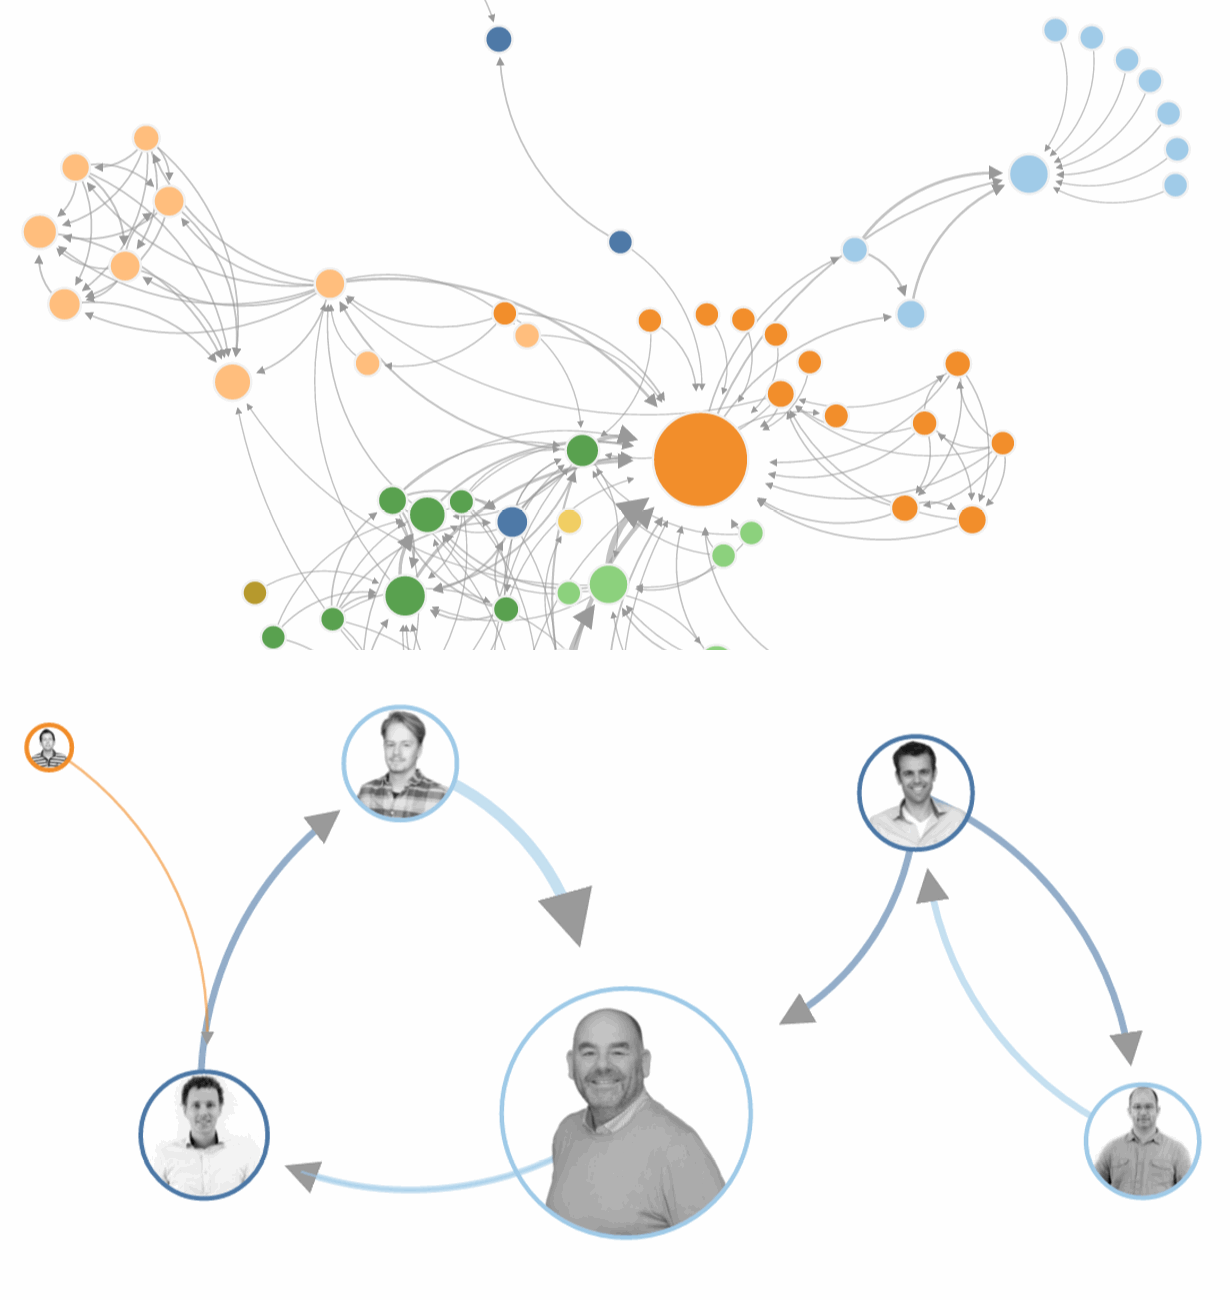
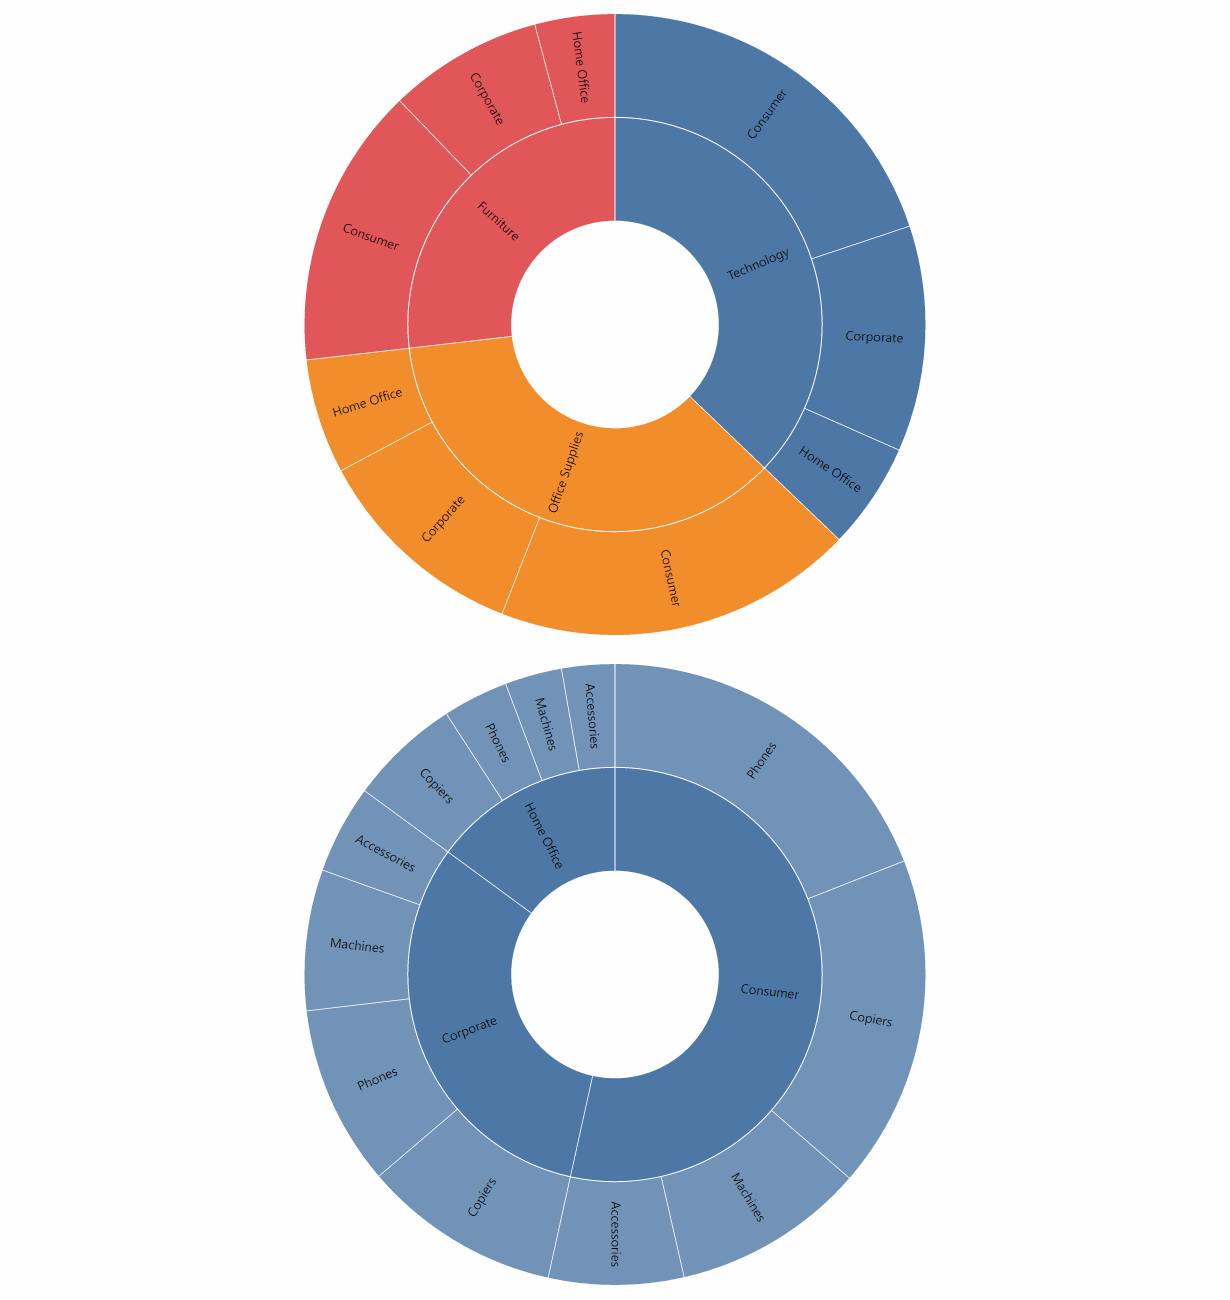
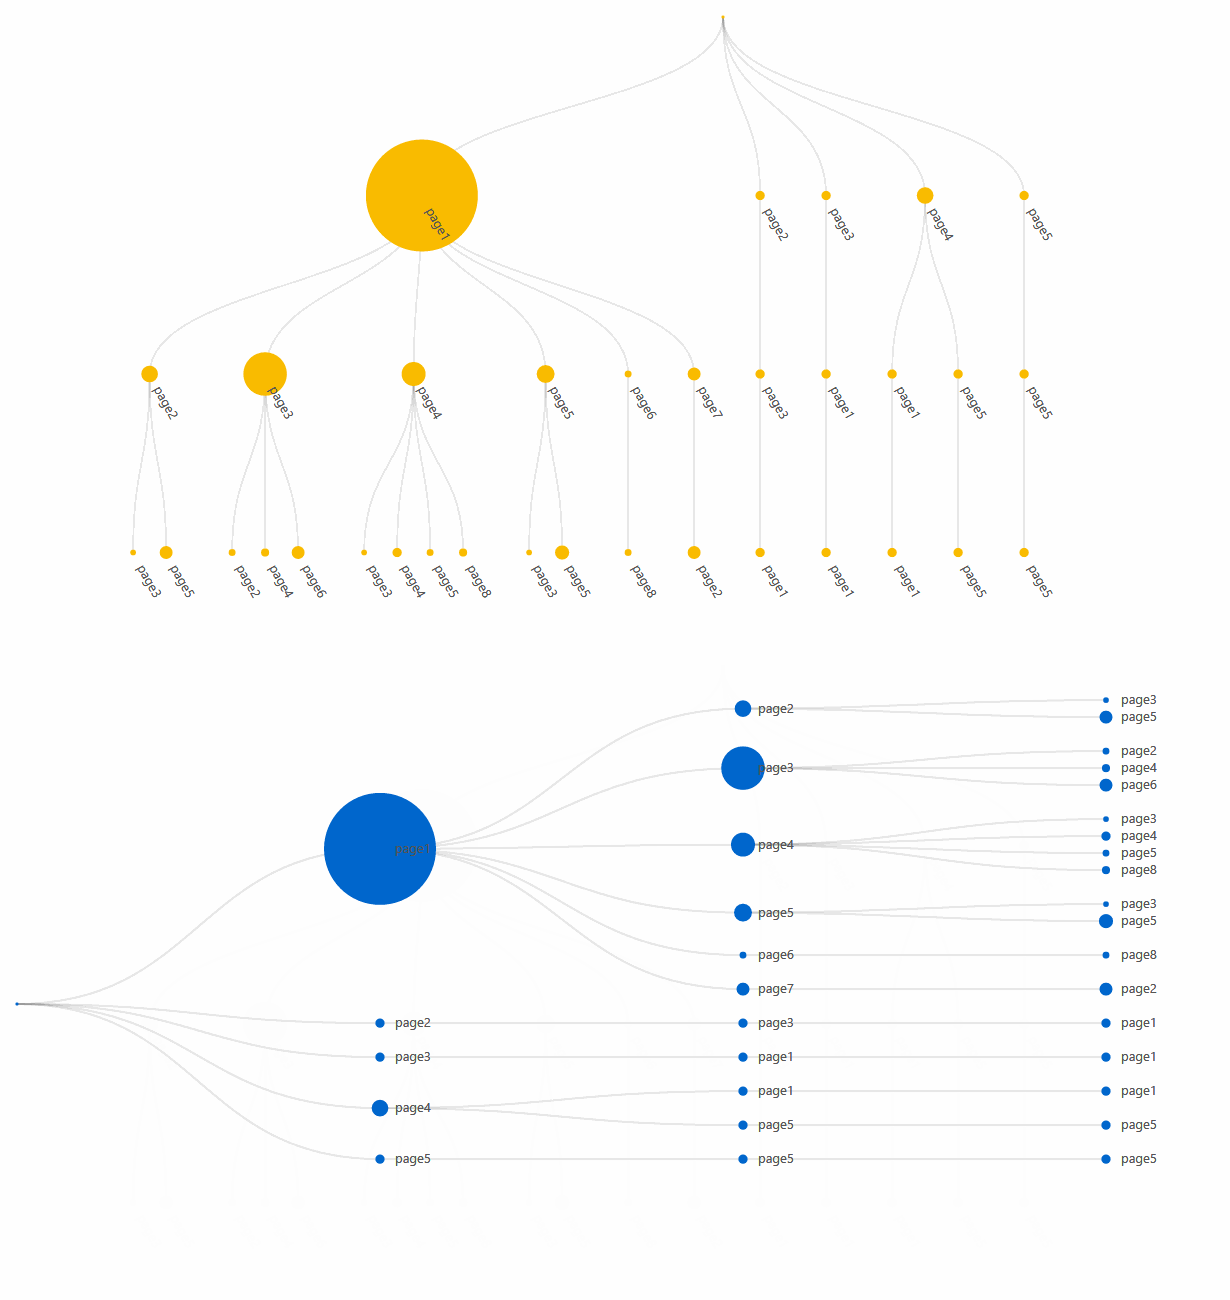
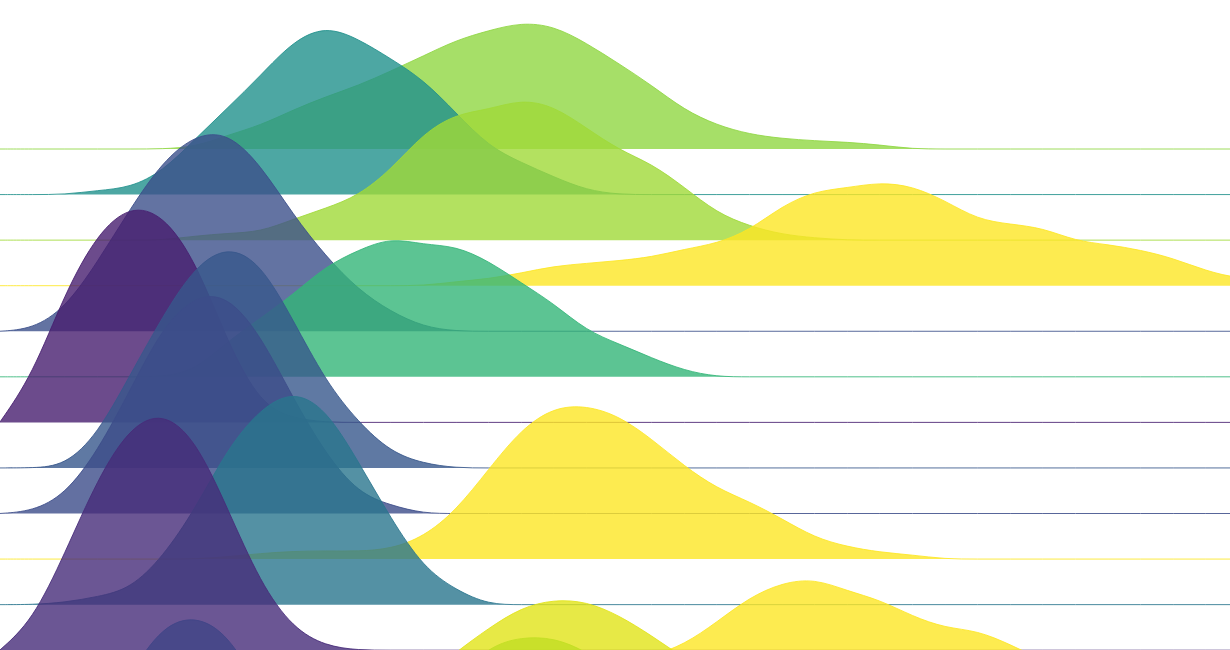
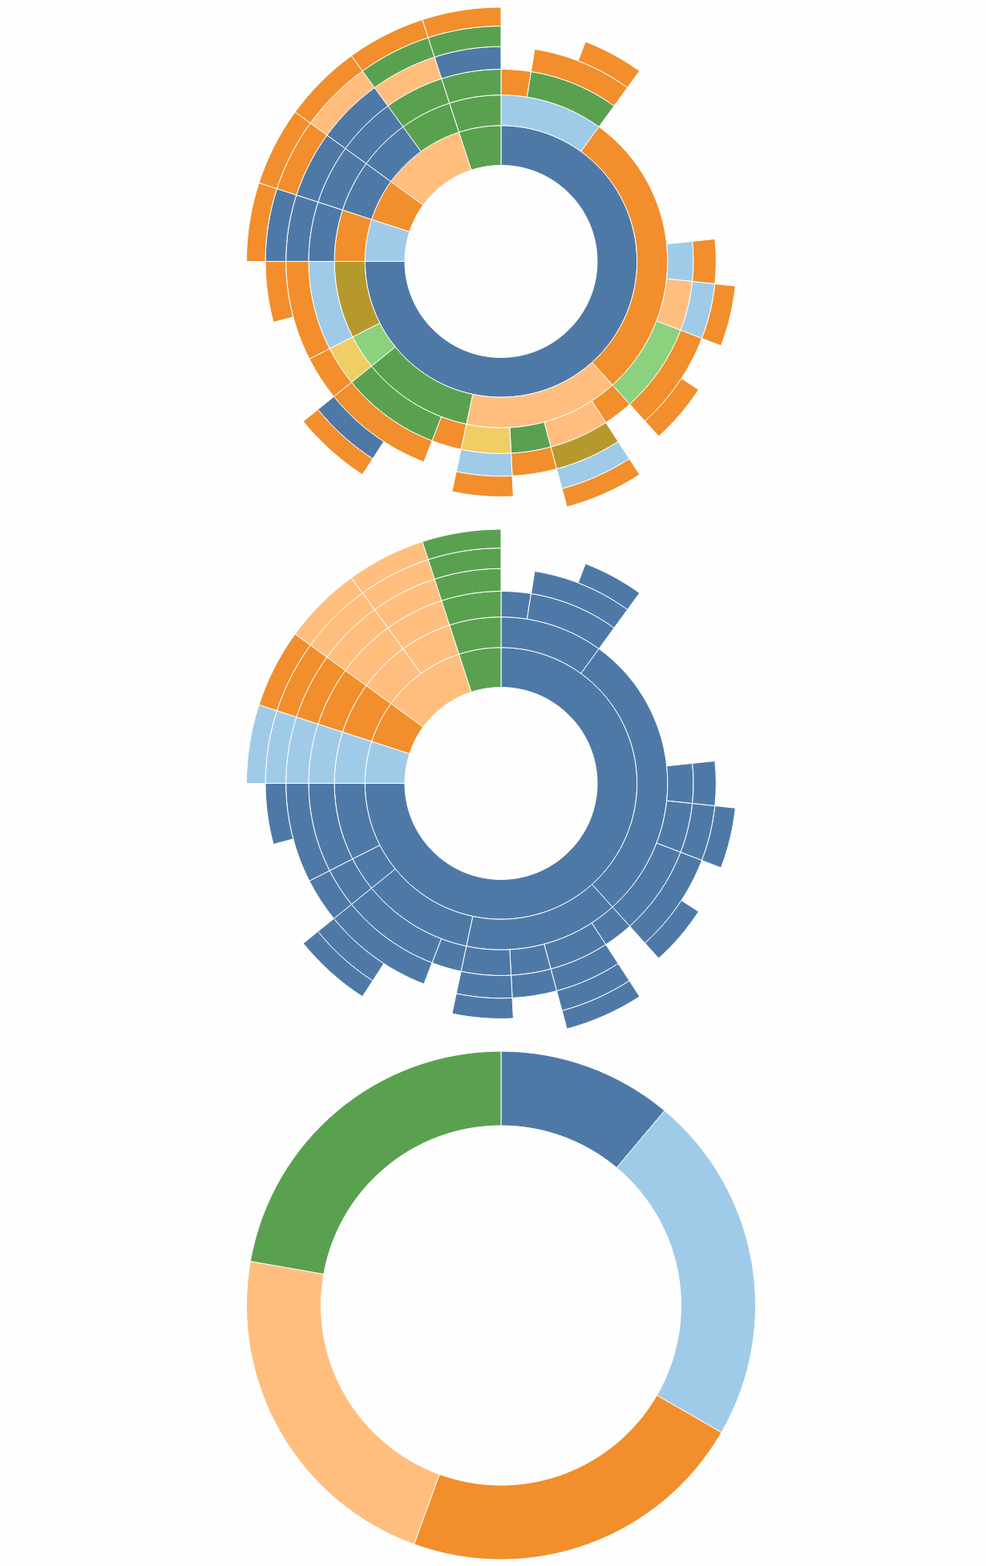
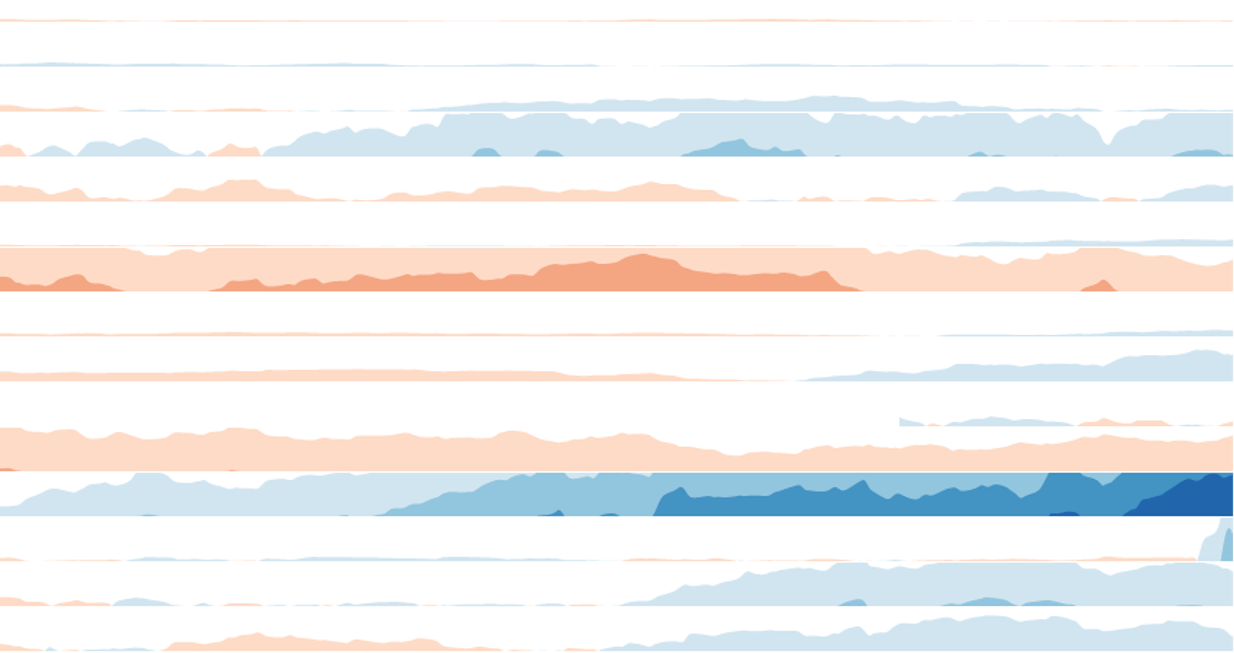
The ShowMeMore extension for Tableau adds new visualization types to your Tableau Desktop Creator. Just drag the extension to your dashboard, select your Graph type and you’re ready to connect some data to your chart.
The free version allows you to use a Sankey Diagram and Network Chart. The premium version adds more graph types like the Radar Chart, Google maps chart and Organization Chart. Have a look at our subscription plans and decide what best fits your needs.
DashboardGuide
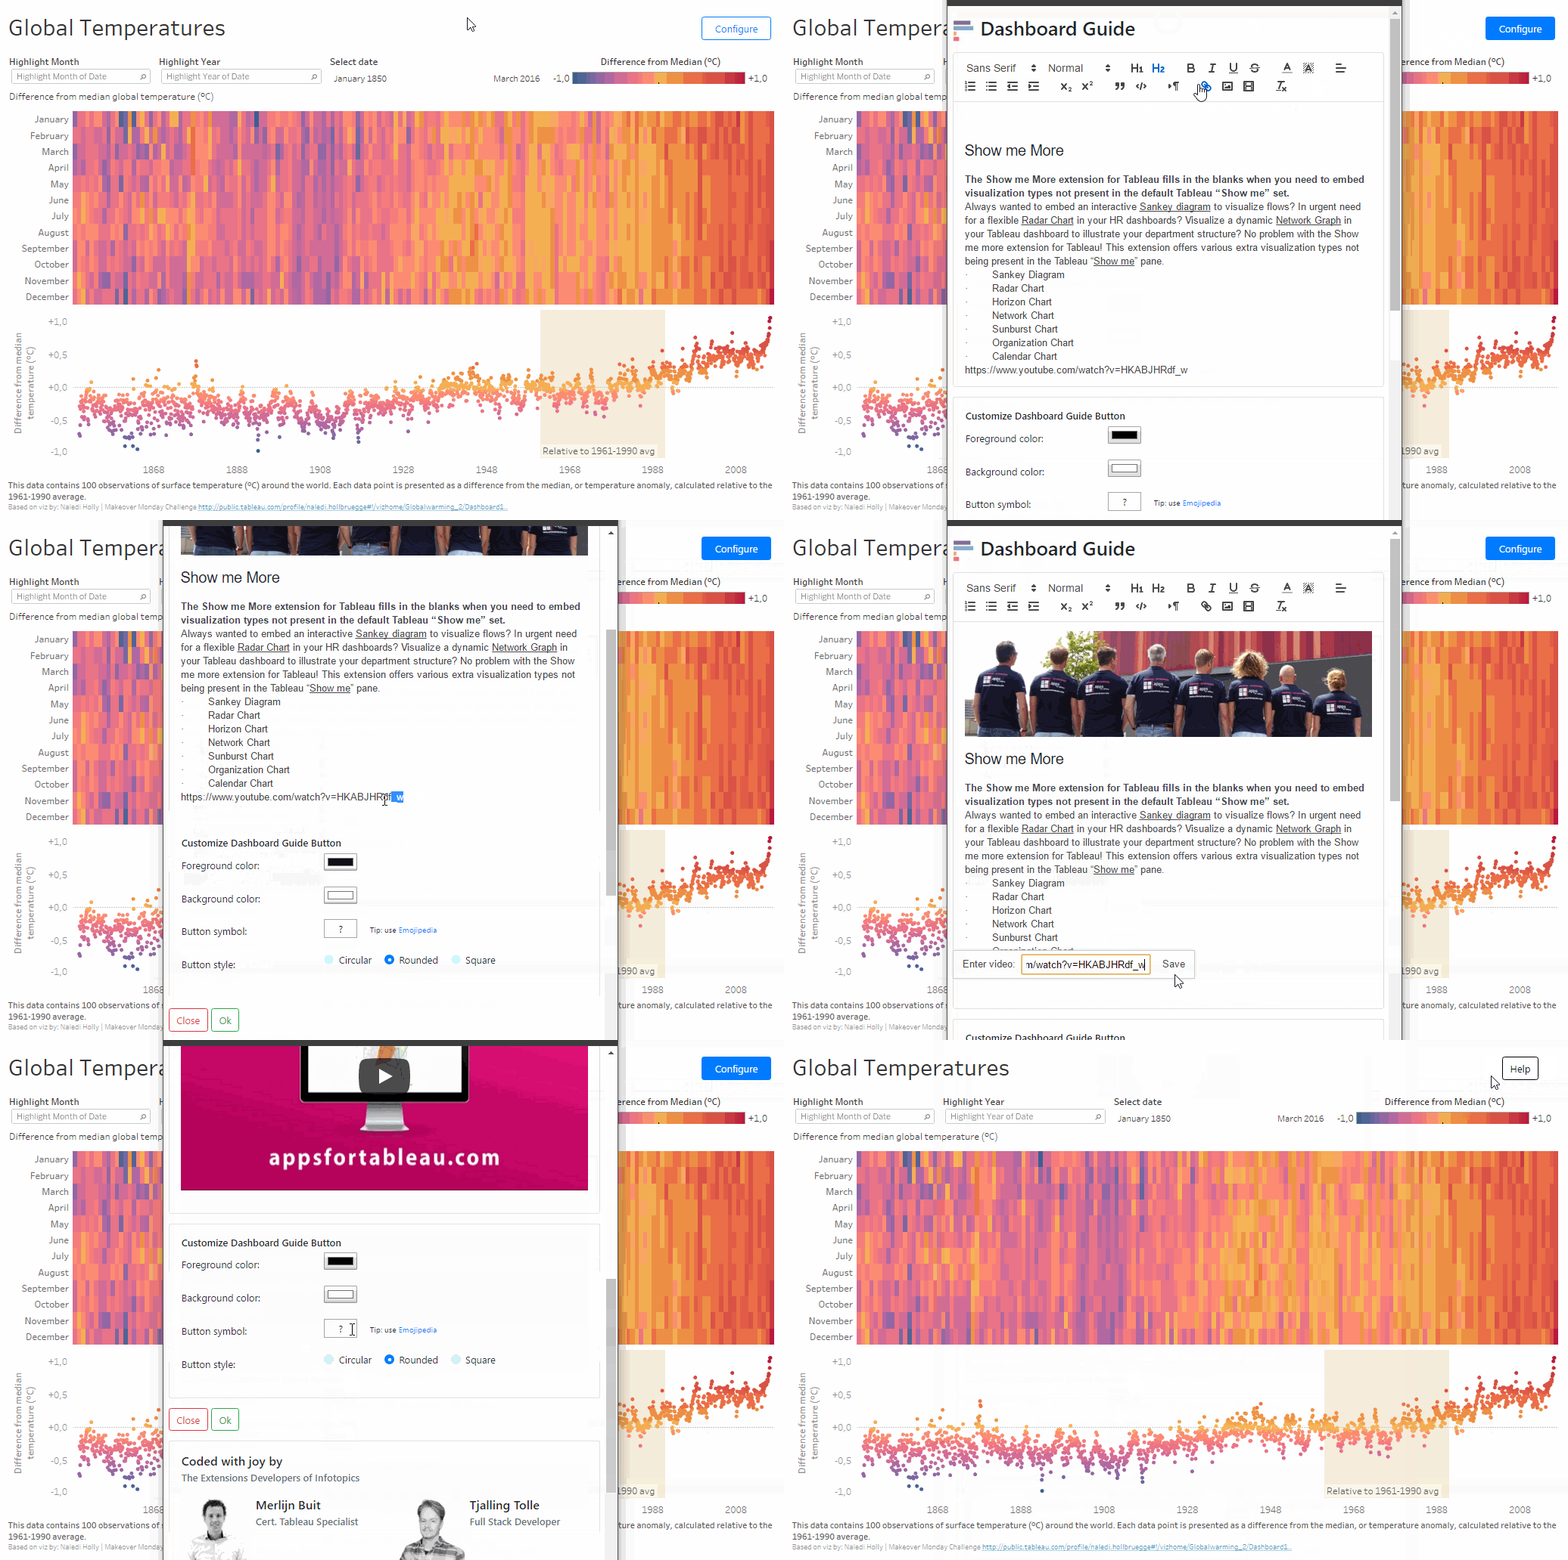
The DashboardGuide extension for Tableau helps you save time, gain quality, and deliver the background information, motivation or even KPI definitions of your dashboard. Explain the content and setup to all users of your dashboards. Tell people how and why you developed your dashboard the way you did en boost user acceptance, experience and enthusiasm.
DashboardGuide, the ultimate help extension for Tableau- dashboard users love it!
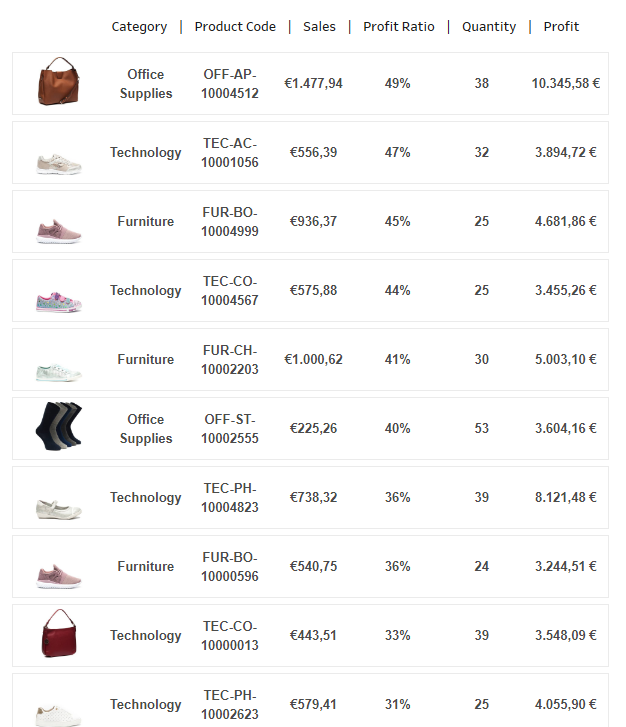
PictureThis – Dynamic image tables in your dashboard
Our new “PictureThis” extension allows you to use Image URL’s from your dataset that automatically create a responsive image table. The images will act as a filter on another target sheet in your dashboard. Images are not stored in your dashboard, will dynamically be lined up in an image table based on your data and can be used as a filter.
Quit using text tables and start using images to filter. A picture is worth a thousand words!
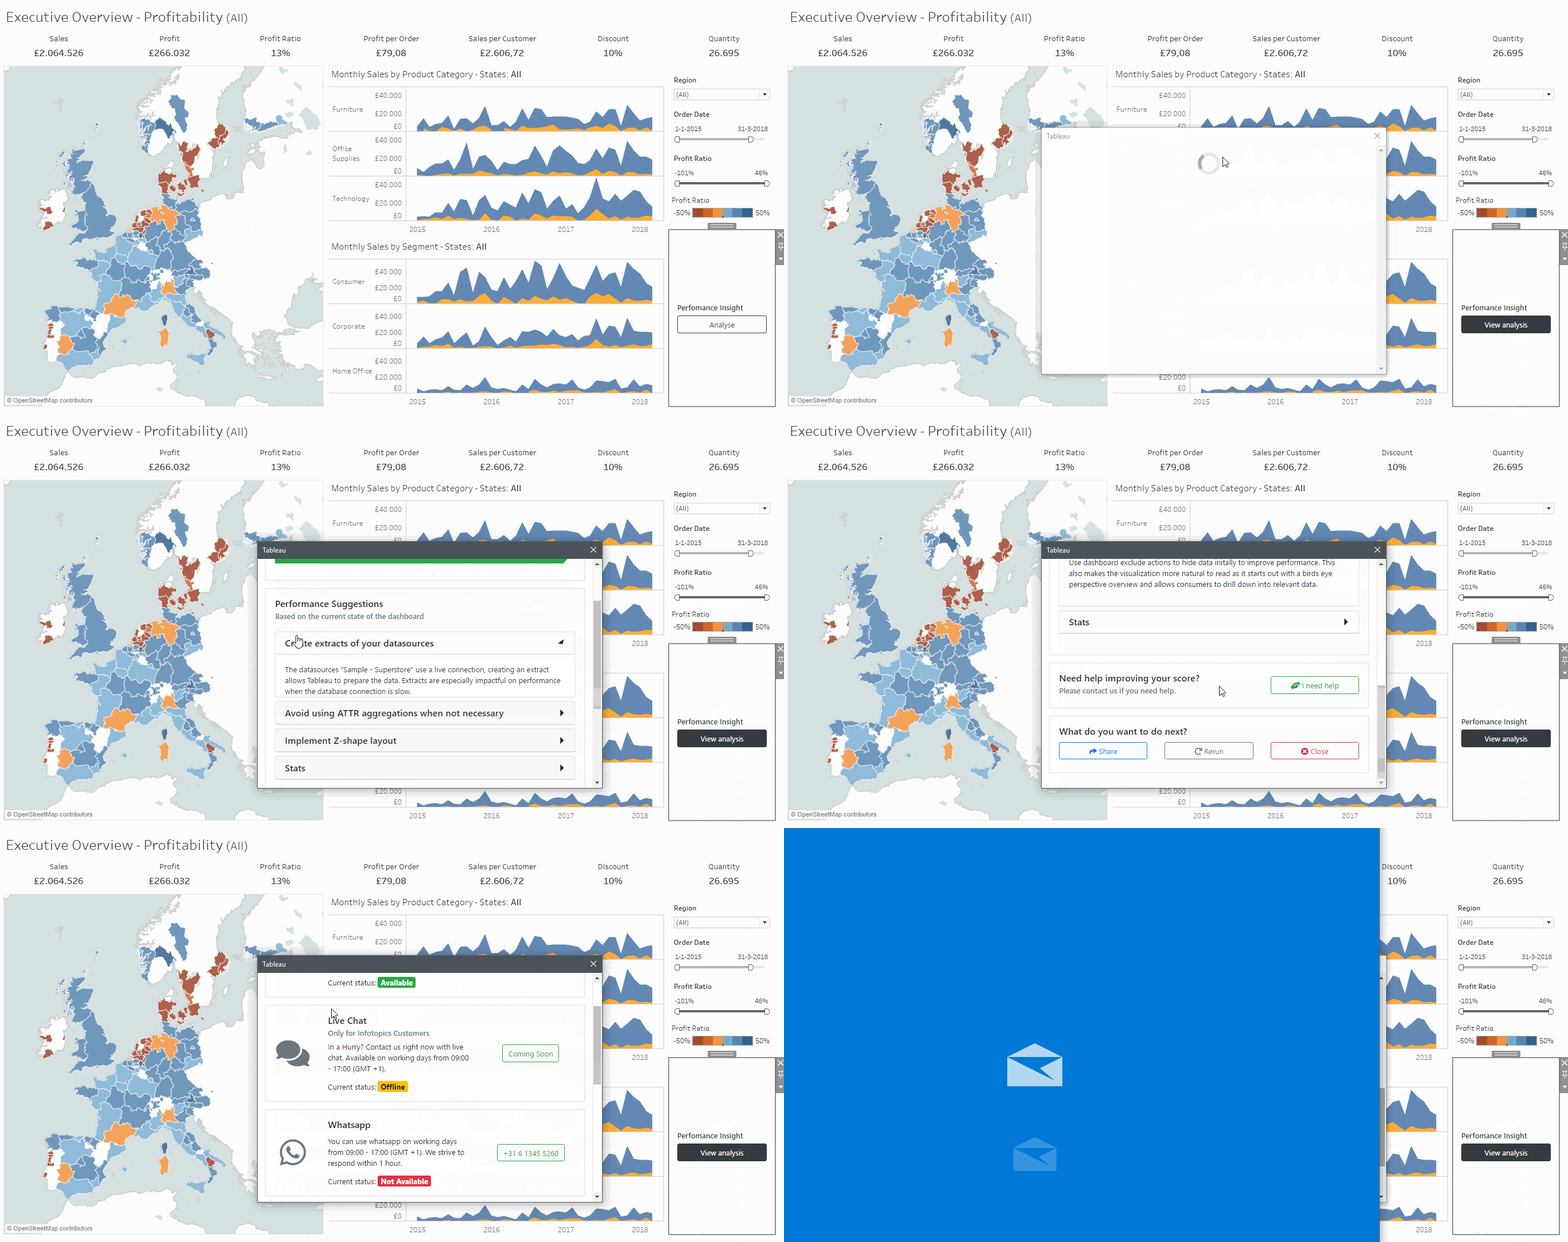
PerformanceInsight
This free Tableau Extension tells you the performance characteristics of the dashboard you build. Where Tableau’s Performance Recorder only measures Query performance and points you in the direction of ‘heavy queries’, this Extension will help you determine why performance might not be as expected.
Receive free but valuable tips and advice on how to improve your dashboard performance. The help of an expert is always just one click away….
500+ organizations are using Apps for Tableau extensions
